# Console overview
[Read this page in HTML](https://www.scopedb.io/docs/guides/cloud-concepts)
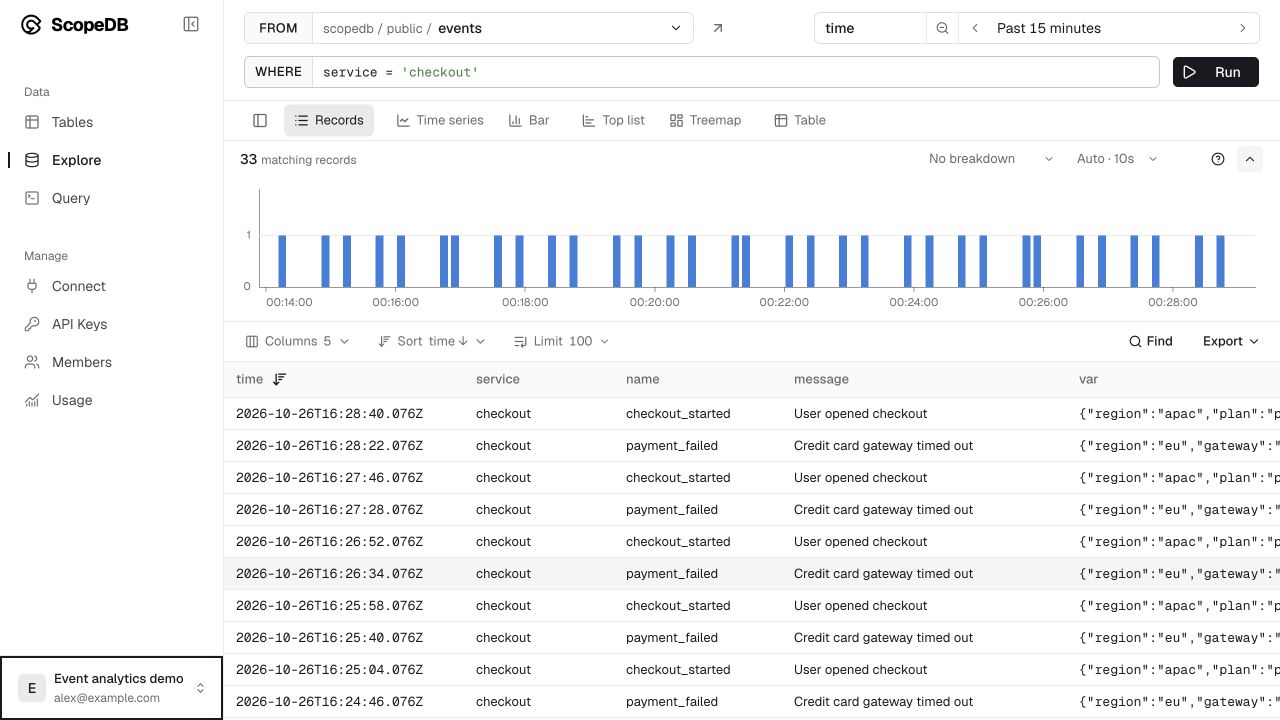
Open [ScopeDB Console](https://console.scopedb.cloud) to work with your data in the browser. Choose your workspace to land on **Home**, where you can copy an agent prompt, connect a terminal or application, or jump back into recent tables and query drafts. From the sidebar, open **Data** to browse the Catalog, manage table definitions, and explore events, or open **Query** to write ScopeQL.
[](https://www.scopedb.io/content/docs/console/explore-records.jpg)
Data combines the Catalog, visual event exploration, and table management in one workspace. The examples in these screenshots use synthetic application events and demonstration accounts.
## Follow an event investigation
1. Open **Data** and select `events` in **Catalog** (under `scopedb` and `public`). Switch to **Manage** when you want to check its columns and storage statistics.
2. In **Explore**, add a filter for the service, event, or time window you are investigating, then select **Run**.
3. Inspect matching records or switch to an analysis view (**Time**, **Bar**, **Top list**, **Treemap**, or **Table**) to compare event counts.
4. Select **View query** and choose **Open in Query** when you want to extend the generated ScopeQL, join another table, or export a custom result.
If you do not have data yet, copy the **Try sample data** agent prompt on **Home** or follow the [quickstart](https://www.scopedb.io/docs/guides/quickstart.md) to create an event table and insert sample records.
## Choose a page
| What you want to do | Open |
| --------------------------------------------------------------------------------- | -------------------------------------------------------------------------------------- |
| Copy an agent prompt, connect a client, or resume recent tables and queries | [Home](https://www.scopedb.io/docs/guides/connect-to-scopedb.md) |
| Browse the Catalog, inspect definitions and statistics, or create and edit tables | **Data** ([Tables in Console](https://www.scopedb.io/docs/guides/console-tables.md)) |
| Filter events, inspect payloads, and build charts | **Data** ([Explore in Console](https://www.scopedb.io/docs/guides/console-explore.md)) |
| Write ScopeQL and inspect or export results | [Query](https://www.scopedb.io/docs/guides/console-query.md) |
| Create or replace an application key | [API Keys](https://www.scopedb.io/docs/guides/authentication.md) |
| Invite teammates and review access | [Members](https://www.scopedb.io/docs/guides/console-members.md) |
| Review compute, storage, and data transfer | [Usage](https://www.scopedb.io/docs/guides/console-usage.md) |
## Know which workspace you are using
A workspace groups your data, members, API keys, and usage. Check the workspace name at the top of the sidebar before running a query or changing a table. Use the [workspace switcher and account menu](https://www.scopedb.io/docs/guides/console-workspaces.md) to switch context, open workspace settings, or manage personal sessions.
Inside a workspace, tables are organized into databases and schemas. The examples use `scopedb.public.events`: database `scopedb`, schema `public`, and table `events`. Use the full name when you need to distinguish similarly named tables.